
About TRI
The Translational Research Institute is a partnership between:
The University of Queensland
Mater Research
Queensland University of Technology
Queensland Health
While also hosting a number of clinical and industry collaborators.
TRI supports a wide range of shared research platforms, from microscopy and animal services to preclinical imaging. Since implementing PPMS in 2015, they’ve managed core facility scheduling, user access, service requests and financial operations through a unified system.
But as internal and partner reporting demands grew, TRI needed more than data access, they needed data insight.
“We began operations in 2012 born of the desire to bring collaboration to science and directly impact the translation of research from the bench to the bedside and back to the bench again.” — Emily Duggan, Director Service Delivery & Quality, TRI
Why TRI Integrated PPMS with PowerBI
PPMS already stored a rich dataset. TRI wanted to leverage it to:
Justify equipment investments using usage and downtime trends
Address staff capacity with clear evidence
Highlight equipment risks and performance bottlenecks
Provide tailored reporting to executives and collaborators
“We needed to move from data collection to data communication.” — Emily Duggan, Director Service Delivery & Quality, TRI
From Raw Data to Strategic Dashboards
1. Planning Equipment Investment
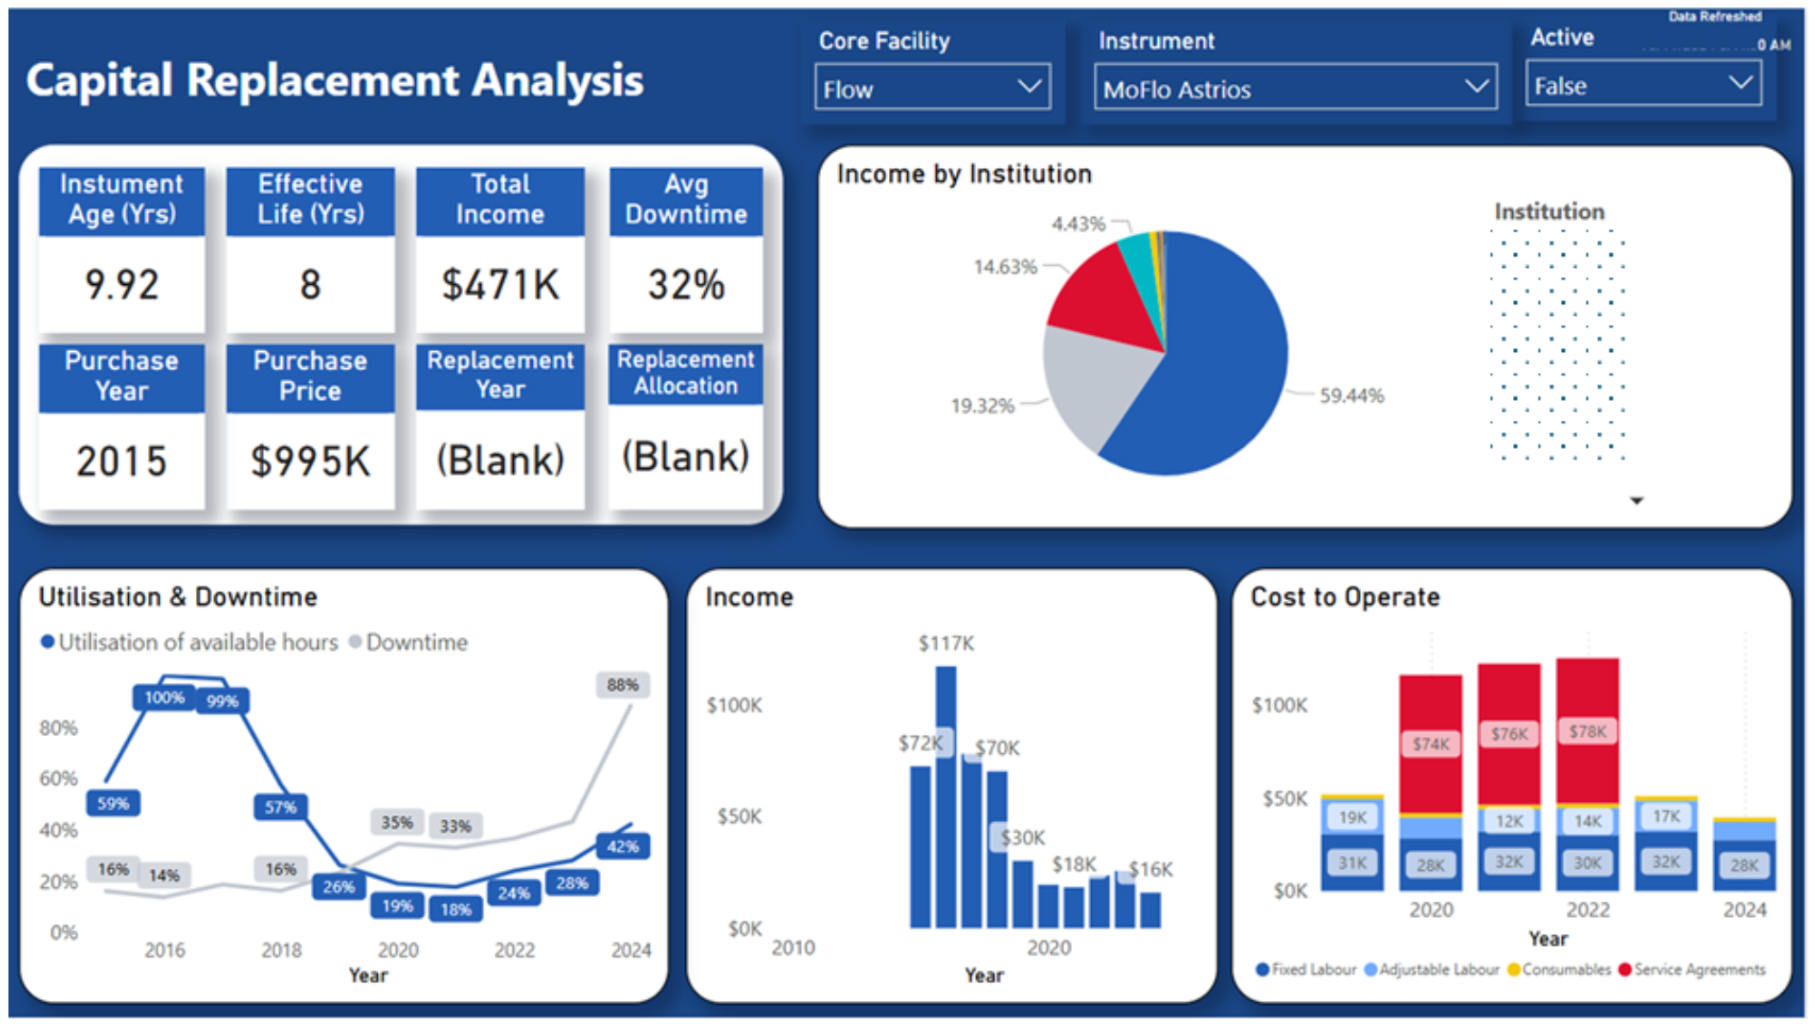
TRI tracks booking trends, repair frequency and downtime for each instrument to help guide capital equipment planning. Monthly reports show which instruments are frequently booked, frequently repaired, or showing signs of overuse.
This has helped:
Identify instruments approaching the end of their service life
Align capital investment requests with real usage data
Make proactive, rather than reactive, infrastructure decisions
PowerBI dashboards make this information visual and actionable for decision-makers.
“The capital replacement analysis dashboard is one of the most powerful tools we have. It breaks down staff time, consumables and service costs, and overlays that with utilisation trends.” — Emily Duggan, Director Service Delivery & Quality
2. Justifying Staffing Needs with Clear Data
Some TRI cores, like microscopy, experienced rapidly rising demand without a corresponding increase in staff. While managers understood the pressure, they needed hard data to make a case for new hires.
With PPMS usage data visualised in PowerBI, the team could:
Pinpoint peaks in usage by time of day
Demonstrate unsupervised use late at night or on weekends
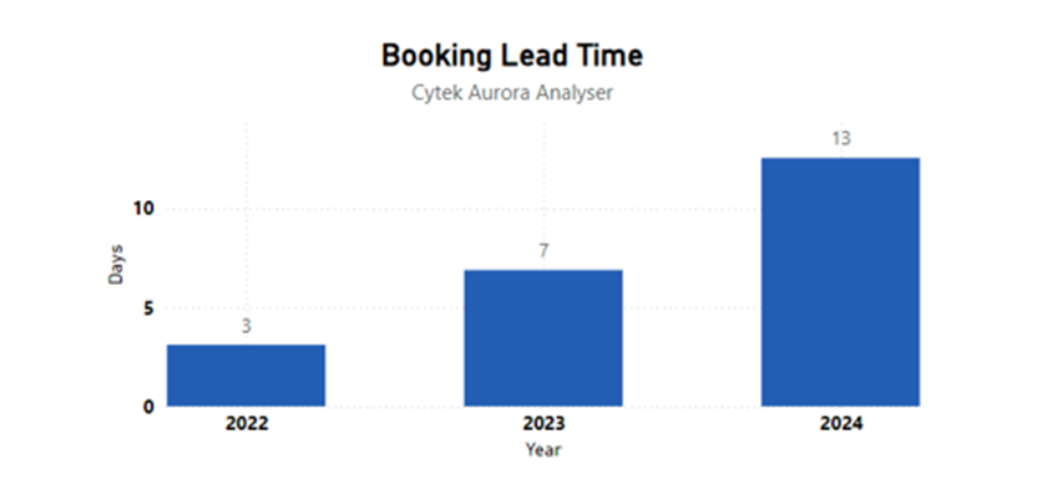
Correlate increased lead times with limited staff availability
This resulted in successful requests for new hires and better oversight, with evidence that was hard to ignore.
“One of our facilities had people booking it at 10pm at night and weekends trying to get on. If 20 labs are using it and can’t book it, that’s the kind of data that builds the case for action.” — Tess Vogts, Core Facilities Manager
3. Tailoring Reports for Different Audiences
TRI uses dashboard permissions to provide just the right amount of information to the right people.
Examples include:
Core Managers see detailed equipment-level reports to plan workload and maintenance
Executives and leadership see higher-level summaries and trend visualisations
Partner institutions are offered custom views to support cross-organisation reporting
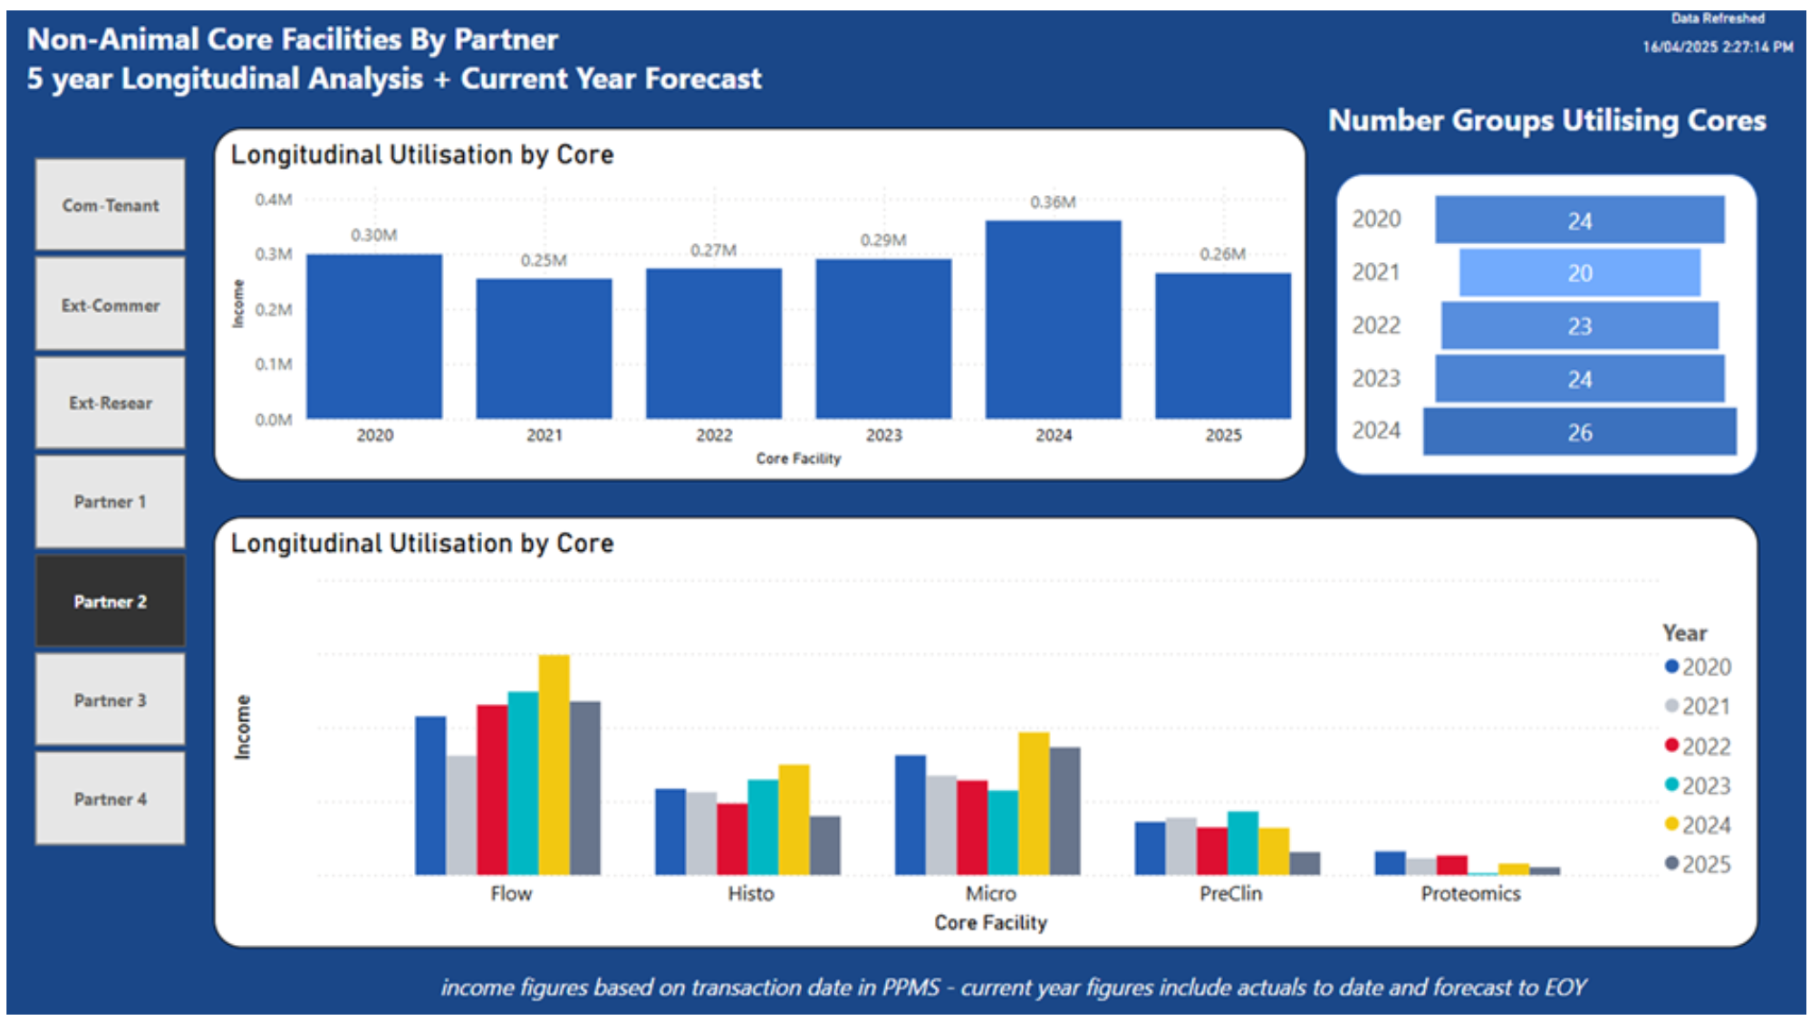
“We realised we needed not just annual snapshots but longitudinal views to support decisions around surge usage, funding or performance dips.” — Emily Duggan, Director Service Delivery & Quality
Principles Behind TRI’s Reporting Success
TRI’s framework is guided by five key principles:
1. One Source of Truth: All dashboards use PPMS data, ensuring consistency across facilities and reports.
2. Granularity: Data is broken down by facility, instrument, user group, and booking type — not just overall numbers.
3. Audience-Specific Views: Every stakeholder gets a view that suits their role, from day-to-day management to high-level strategy.
4. Historical Context: Dashboards are built on longitudinal data, supporting trend analysis and long-term planning.
5. Secure, Governance-Aware Publishing: Dashboards are securely shared through PowerBI Service with planned improvements for broader institutional access.
“Having one data source, PPMS, that feeds into a consistent reporting model across our platforms has been really powerful. It means everyone’s working from the same numbers.” — Tess Vogts, Core Facilities Manager
What’s Next for TRI?
TRI is continuing to enhance their reporting and decision-making capabilities with several upcoming priorities:
AI & Forecasting: Reviewing PowerBI Copilot and Microsoft AI tools to support predictive capacity planning
Inter-Institutional Dashboard Sharing: Piloting secure dashboard access across UQ, QUT, and Mater Research
Consistent Utilisation Metrics: Defining baselines for 24/7 vs business hours usage across instruments
Transparent Pricing Models: Capturing and communicating off-peak and holiday usage within PPMS dashboards
These steps are part of TRI’s broader goal to make data not just available but meaningful.
Early Indicators of Impact
While KPIs are still being defined, the early signs are promising:
Faster turnaround on equipment purchasing decisions
More efficient internal reporting cycles
Increased engagement from both facility managers and institutional leadership
Greater visibility of facility performance in board-level and external reports
Case Study Snapshots
Responding to Unplanned Demand on New Equipment
TRI deployed a new high-performance cytometry instrument that rapidly surpassed expectations in terms of usage. Bookings exceeded 100% of projected capacity and researchers began booking sessions during evenings and weekends, raising operational and safety concerns.
Using PowerBI dashboards built on PPMS data, the team:
Visualised usage trends by hour, day and user group
Identified lack of redundancy as a key operational risk
Flagged the need for staffing review and policy updates around after-hours access
The dashboards helped internal teams respond quickly, initiating changes in access procedures and creating a clearer case for investment in backup systems.
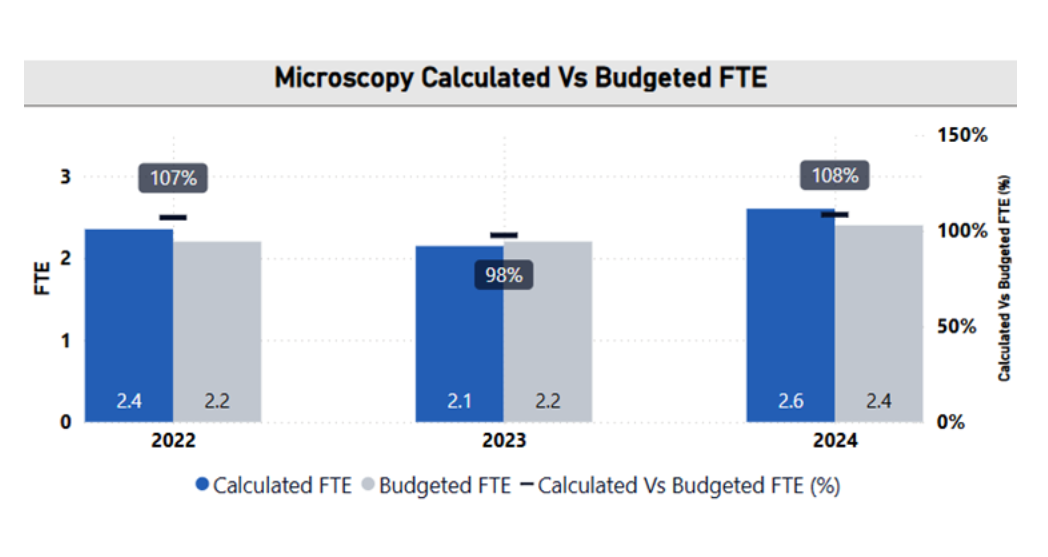
Microscopy Staffing Justified Through Data
In the microscopy core, demand had been steadily increasing but until recently there was no hard evidence to support additional hiring. Informal feedback pointed to strain, but resource requests lacked backing.
Dashboards layered over PPMS data provided:
Clear usage peaks by time of day and user group
Documentation of bookings during periods without staff presence
Year-on-year growth in instrument hours and user traffic
This enabled leadership to approve new staff positions and start planning oversight adjustments based on usage profiles.
Turning Insight into Impact
TRI’s integration of PPMS and PowerBI has transformed the way its research infrastructure is managed, not only in terms of operations, but in how value is communicated across teams, partners and leadership.
It’s a model that blends real-time data with long-term strategy and one that’s very adaptable to other institutions.
Curious how Stratocore can help your organisation build a reporting model that supports smarter decisions? Get in touch.
Related Content

Case Studies

The Cancer Research UK Cambridge Institute Partners with Stratocore to Enhance Core Facility Management
The keys to a successful PPMS implementation...
Case Studies
How TRI Leverages PPMS Data to Drive Strategic Research Infrastructure Management
How The Translational Research Institute (TRI) turns Stratocore PPMS usage and performance data into powerful insights: shaping decisions around staffing, equipment investment and long-term planning....